37.3% Of Georgia Professionals Are Minorities, 7th Most in the U.S.
Friday, September 23rd, 2022
In the last few years, policymakers, experts, and the public at large have paid more attention than ever to disparities faced by America’s racial and ethnic minorities. And some of the starkest gaps minorities face are in the realm of economic opportunity.
White workers earn significantly more than members of other racial and ethnic groups, and these gaps have grown over time—even as minorities’ incomes have increased. These gaps in wages also help explain racial disparities in other socioeconomic conditions, like wealth and health outcomes.
Many experts point to education as a critical tool for addressing these gaps. Educational attainment is a major predictor of earning potential as the U.S. labor force has become increasingly professionalized. Many of the occupations that pay the best are growing the fastest, and commonly require college degrees. Additionally, many good jobs that did not formerly require college degrees do now, a phenomenon experts refer to as degree inflation.
 |
These trends have made educational attainment more important than ever for one’s earning potential. High school graduates earn around $12,000 more on average annually than non-graduates, while bachelor’s degree holders earn nearly twice what a high school graduate does. Advanced degree holders receive the highest average wages of any category, at $117,594 per year.
Earnings for workers with more education have also grown faster than earnings of less-educated workers over time. Since 1980, wages in 2022 dollars have increased by 43.2% for advanced degree holders and 29.5% for bachelor’s degree holders. High school graduates have seen an 11.1% increase over time, while non-high school graduates have seen wages rise by just 2.7%.
But higher education—and the earning potential that comes with it—is often out of reach for historically disadvantaged populations in the United States. Students from most racial and ethnic minority groups face more challenges in accessing college, paying for it, and persisting with their degrees than white students. As a result, white and Asian college students tend to have higher college completion rates.
 |
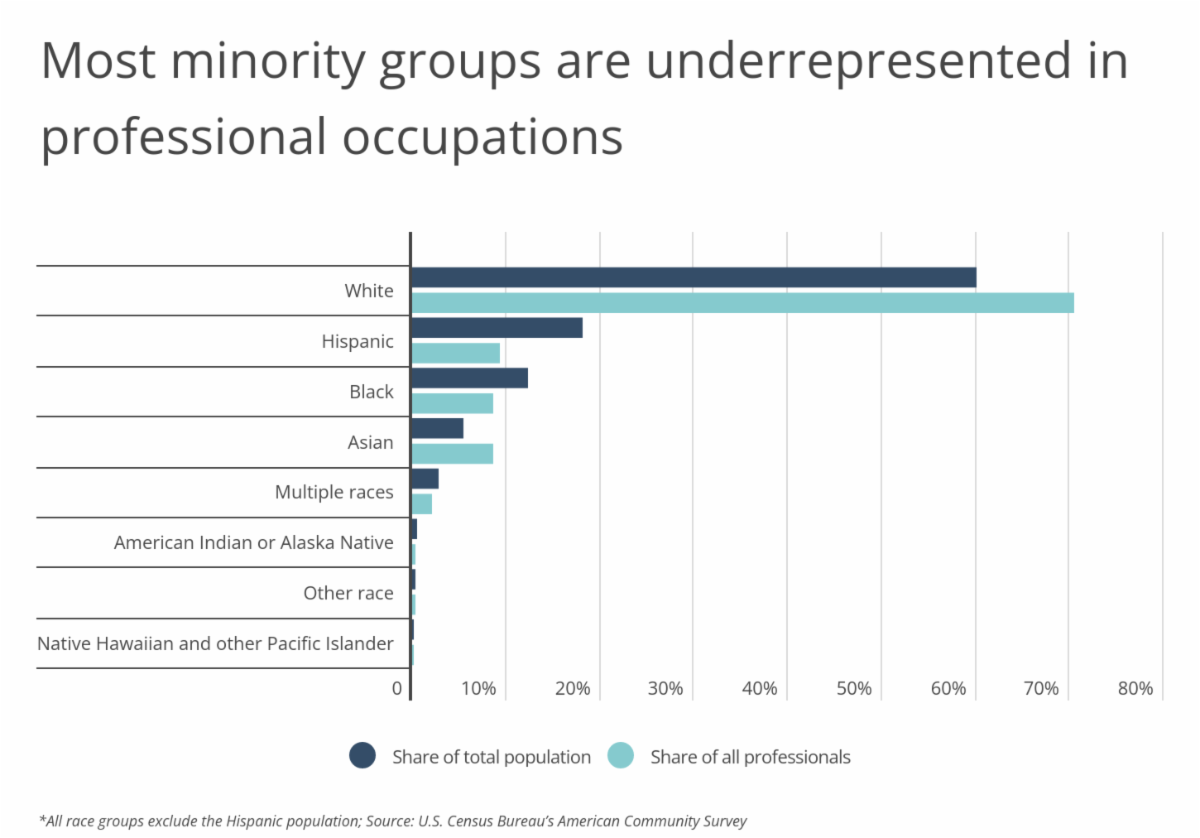
This creates gaps in which workers are able to access higher-earning occupations requiring higher education. For example, White (non-Hispanic) and Asian professionals are overrepresented in professional occupations based on their share of the overall population. Whites represent 60.1% of the total population but 70.5% of the professional workforce, while for Asian Americans, those figures are 5.5% and 8.7%, respectively. The opposite is true of other racial categories. The share of Hispanics in professional occupations (9.3%) is around half their share of the total population (18.2%), while Black Americans constitute 12.3% of the population and just 8.6% of professionals.
In some parts of the country, however, racial and ethnic minorities do represent a larger portion of the professional workforce. States with a larger white population tend to have fewer such workers, while highly diverse states naturally tend to have the greatest share of minorities in professional occupations.
 |
Many primarily white states in New England and the Midwest have the nation’s lowest percentages of minority professionals, led by Maine, where just 5.7% of professionals identify as minorities. Hawaii, where just 22.9% of the population identifies as non-Hispanic white, leads the U.S. in the share of minorities in professional occupations at 68.8%. And four other states with large minority populations—California, New Mexico, Texas, and Maryland—have shares above 40%.
At the metro level, the same pattern holds. Many of the U.S.’s most diverse cities lead the country in their share of minority professionals, with a number of cities in California, Texas, and Florida topping the list. In only five out of more than 250 metros included in the study were minorities overrepresented among professional workers. Notably, many of the locations with the smallest gaps were college towns such as State College, PA, Blacksburg, VA, and Ithaca, NY.
The data used in this analysis is from the U.S. Census Bureau and the U.S. Bureau of Labor Statistics. To determine the locations with the most minority professionals, researchers at Smartest Dollar calculated the percentage of professionals—defined as those in occupations that typically require a bachelor’s degree or higher—that are minorities. In the event of a tie, the location with the greater total professionals that are minorities was ranked higher. For the purposes of this analysis, minorities are considered to be all people who are not non-Hispanic white.
Here is a summary of the data for Georgia:
-
Percentage of professionals that are minorities: 37.3%
-
Percentage of total population that are minorities: 47.9%
-
Total professionals that are minorities: 617,423
-
Median annual wage for minority full-time professionals: $60,000
-
Median annual wage for all full-time professionals: $65,000
-
Median annual wage for all full-time workers: $45,000
For reference, here are the statistics for the entire United States:
-
Percentage of professionals that are minorities: 29.5%
-
Percentage of total population that are minorities: 39.9%
-
Total professionals that are minorities: 15,972,391
-
Median annual wage for minority full-time professionals: $65,000
-
Median annual wage for all full-time professionals: $70,000
-
Median annual wage for all full-time workers: $48,000
For more information, a detailed methodology, and complete results, you can find the original report on Smartest Dollar’s website: https://smartestdollar.com/


